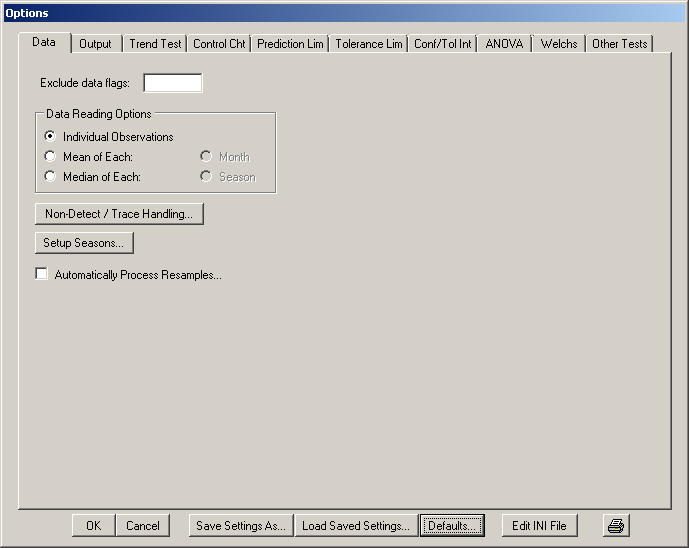
Figure 5.4: The Data tab of the Configure Sanitas window (Options/Configure Sanitas)
Exclude data flags: Sanitas allows you to deselect individual observations or sampling events by entering the associated flag(s), both in single-constituent and multiple-constituent processing mode. To do so, enter the character(s) in this field. The flags must be entered in the data file prior to running the batch job (please refer to the chapter on Input Data File Structure for more information). Note that Sanitas checks each datum for an associated flag that is a substring of the list entered in this field. So, for example, if this field contains “ND”, the flag “D” will also be excluded. Changes to this field will affect all Views, including those that are not currently open.
If the first character entered in the Exclude data flags field is a minus sign (“-“) then the behavior is reversed, and data without the entered flag character(s) are deselected.
Data Reading Options: Allows combining of multiple observations by month or season. Generally for use in situations in which the number of observations would otherwise be too large. Maximums depend on available memory and test type: generally a View can handle thousands of observations, but a statistic such as Sen's Slope, because of the algorithm, will be noticeably slower with more than a few hundred observations.
Non-Detect / Trace Handling… Selecting this option will display the Non-Detect / Trace Handling window.
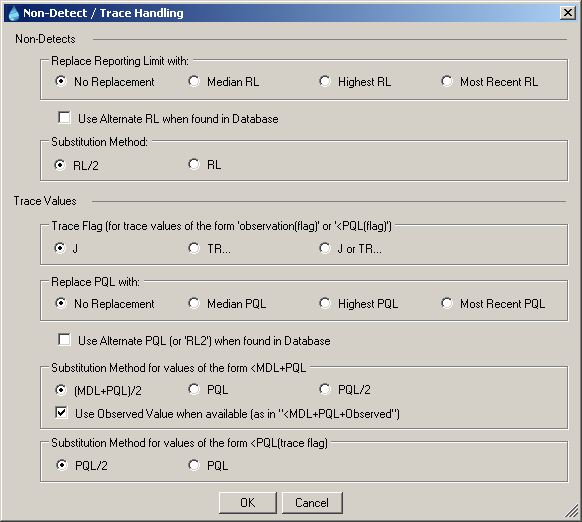
Figure 5.5: Non-Detect / Trace Handling Window
Reporting limits can be explicitly entered for any or all constituents. To do so, select Data File Operations/Edit… from the File menu in the View window, and click on the Constituents tab (see Database – Editing). When a user-specified Alternate Reporting Limit (ARL) is present in the “Alternate RL” (MDL) and/or “Alternate RL2” (PQL) fields, and if the Replace Reporting Limit when Alternate RL found in Database checkbox is checked, reporting limits (i.e. as found in non-detects and trace values) for that constituent will be replaced with the applicable value(s) from the data file. When no ARL is entered for a constituent, the behavior will depend on the settings in this window (which pertain mostly to the <RL rather than <MDL+PQL syntax, the latter becoming increasingly uncommon). No Replacement is the default, and means that each censored value will be individually processed as selected in the Substitution Methods section of this window. Alternately, each censored value can be replaced with the median, highest or most recent reporting limit in the selected data for that constituent. In no case will the database be altered, nor will these changes affect the View, which always shows the data as found in the database, pre-replacement/substitution.
The Substitution Method determines the final numerical value that will be used in analyses. By default non-detects (or trace values if stored as <PQL without the trace flag) are replaced with half of the MDL (or PQL), and trace values using the syntax <MDL+PQL are replaced with the average of the MDL and PQL. In the latter case, an option exists to use the observed value, if it is included.
Note: some numerical routines specify a substitution behavior by design, for example the Kaplan-Meier non-detect adjustment, which uses the RL. In such cases the selected Substitution Method is temporarily ignored for the purpose of consistency with the source documents.
Setup Seasons…: Click to manually choose the start date (month and day) of up to 24 seasons. This option currently applies only to seasons limited to one calendar year. The format is “month, day”, i.e. January 1 would be 1,1. Alternately, the system will assign default seasons either as shown above or as the first day of each month (the former being four and the latter being 12 seasons).
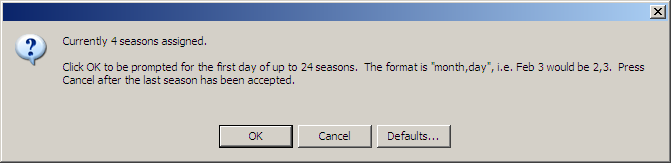
Figure 5.6: Setup Seasons Window
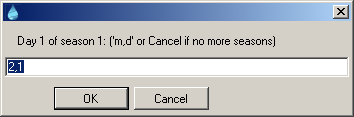
Figure 5.7: Setup Seasons Window II
Automatically Process Resamples: Selecting this option will cause the system to prompt for a retest plan. Choices are: 1 of 2, which means two total samples of which one is a resample and must pass; 1 of 3, which means three total samples of which two are resamples, one of which must pass; 1 of 4, which means four total samples of which three are resamples, one of which must pass; 2 of 3, which means three total samples of which two are resamples, both of which must pass or; 2 of 4, also known as the "modified California" approach, which means four total samples of which three are resamples, two of which must pass. The system will then replace values as the data are read into the system based on the presence of "R" flags (case INsensitive). It is the responsibility of the user to ensure that "R" flags are present where applicable in the data file (see the sections on data flags for more information). Specifically, the system assumes that the date preceding the date of a sample flagged with an "R" is the "original" sample to be replaced. So the original value should NOT have an "R" flag - the "R" flag is associated with its resample(s). Some examples follow. For the 1 of 2 plan the system will replace the original value with the "R"-flagged value. For 1 of 3 it will replace the original value (a value followed by two "R" values) with the lower of the two "R" values. For 2 of 3 it will substitute the higher of the two "R" values.